_paired_datapoints
Paired datapoint plotting helpers from _plotting/_datapoints.py.
Main entry point
paired_datapoints
paired_datapoints
paired_datapoints(...) draws paired reference and target datapoints from
either an AnnData object or a wide pandas.DataFrame. It is intended for
Pre/Post, ref/target, and ref_vs_target_adata() source-value inspection.
The function builds a deterministic long-form plotting table first, then draws one panel per selected variable or variable metadata group. It returns the figure, axes, and that plotting table.
Full signature
def paired_datapoints(
    input_data: anndata.AnnData | pd.DataFrame | None = None,
    *,
    adata: anndata.AnnData | None = None,
    df: pd.DataFrame | None = None,
    var_df: pd.DataFrame | None = None,
    var_names: Sequence[str] | None = None,
    var_groupby_key: str | None = None,
    collapse_mode: Literal["stack", "aggregate", "all"] = "aggregate",
    collapse_func: Literal[
        "mean",
        "median",
        "sum",
        "min",
        "max",
        "count",
        "select_max_ref_value",
    ] = "mean",
    layer: str | None = None,
    use_raw: bool = False,
    groupby_key: str = "Pre_or_Post_obs_col",
    groupby_key_target_value: Any = "Post",
    groupby_key_ref_value: Any = "Pre",
    pair_by_key: str | None = None,
    subject_col: str = "Subject_ID",
    ref_values_obsm_key: str | None = None,
    target_values_obsm_key: str | None = None,
    target_min_value: float | None = None,
    target_max_value: float | None = None,
    ref_min_value: float | None = None,
    ref_max_value: float | None = None,
    bounds_fill_missing: bool = False,
    bounds_fill_missing_paired_only: bool = False,
    filter_vars_by_isin_lists: Mapping[str, Sequence[Any]] | None = None,
    filter_obs_by_isin_lists: Mapping[str, Sequence[Any]] | None = None,
    subplot_by_obs_key: str | None = None,
    subset_obs_key: str | None = None,
    subset_var_key: str | None = None,
    subset_order: Sequence[Any] | None = None,
    palette: Sequence[Any] | str | None = palettes.tol_colors,
    subset_palette: Sequence[Any] | str | None = None,
    connect_lines: bool = True,
    line_alpha: float = 0.55,
    line_color: Any = "0.55",
    line_width: float = 0.9,
    line_style: str = "--",
    jitter_amount: float = 0.2,
    random_seed: int | None = 0,
    point_size: float = 80,
    point_alpha: float = 0.85,
    boxplot: bool = True,
    boxplot_width: float = 0.55,
    boxplot_showfliers: bool = False,
    ncols: int = 3,
    figsize: tuple[float, float] | None = None,
    sharey: bool = False,
    ylims: Sequence[float] | None = None,
    ylabel: str | None = None,
    xlabel: str | None = None,
    title: str | None = None,
    subplot_title_var_col: str | None = None,
    subplot_title_y: float | None = None,
    title_fontsize: int = 14,
    title_y: float | None = None,
    axis_label_fontsize: int = 12,
    tick_label_fontsize: int | None = None,
    legend_fontsize: int | None = None,
    legend_loc: str | int | None = None,
    legend_bbox_to_anchor: tuple[float, ...] | None = None,
    legend_scope: Literal["axis", "figure"] = "axis",
    legend: bool = False,
    dropna: bool = True,
    nas2zeros: bool = False,
    dropzeros: bool = False,
    show: bool = True,
    savefig: bool = False,
    file_name: str = "paired_datapoints.png",
    logger: logging.Logger | None = None,
    log_level: int | str | None = None,
    allow_unused_params: bool = False,
    **params: Any,
) -> tuple[plt.Figure, dict[str, plt.Axes], pd.DataFrame]:
Basic AnnData example
import adata_science_tools as adtl

fig, axes, plot_df = adtl.paired_datapoints(
    adata=adata,
    var_names=["IL6"],
    groupby_key="Pre_or_Post_obs_col",
    groupby_key_ref_value="Pre",
    groupby_key_target_value="Post",
    pair_by_key="Subject_ID",
    subset_obs_key="Treatment",
    legend=True,
    show=False,
)
Title and axis label placement
Use title_y and subplot_title_y to move the figure title or subplot titles
vertically. Use xlabel="" to suppress the x-axis label below the Pre/Post tick
labels.
fig, axes, plot_df = adtl.paired_datapoints(
    adata=adata,
    var_names=["IL6"],
    pair_by_key="Subject_ID",
    title="Paired IL6",
    title_y=1.03,
    subplot_title_y=1.05,
    xlabel="",
    show=False,
)
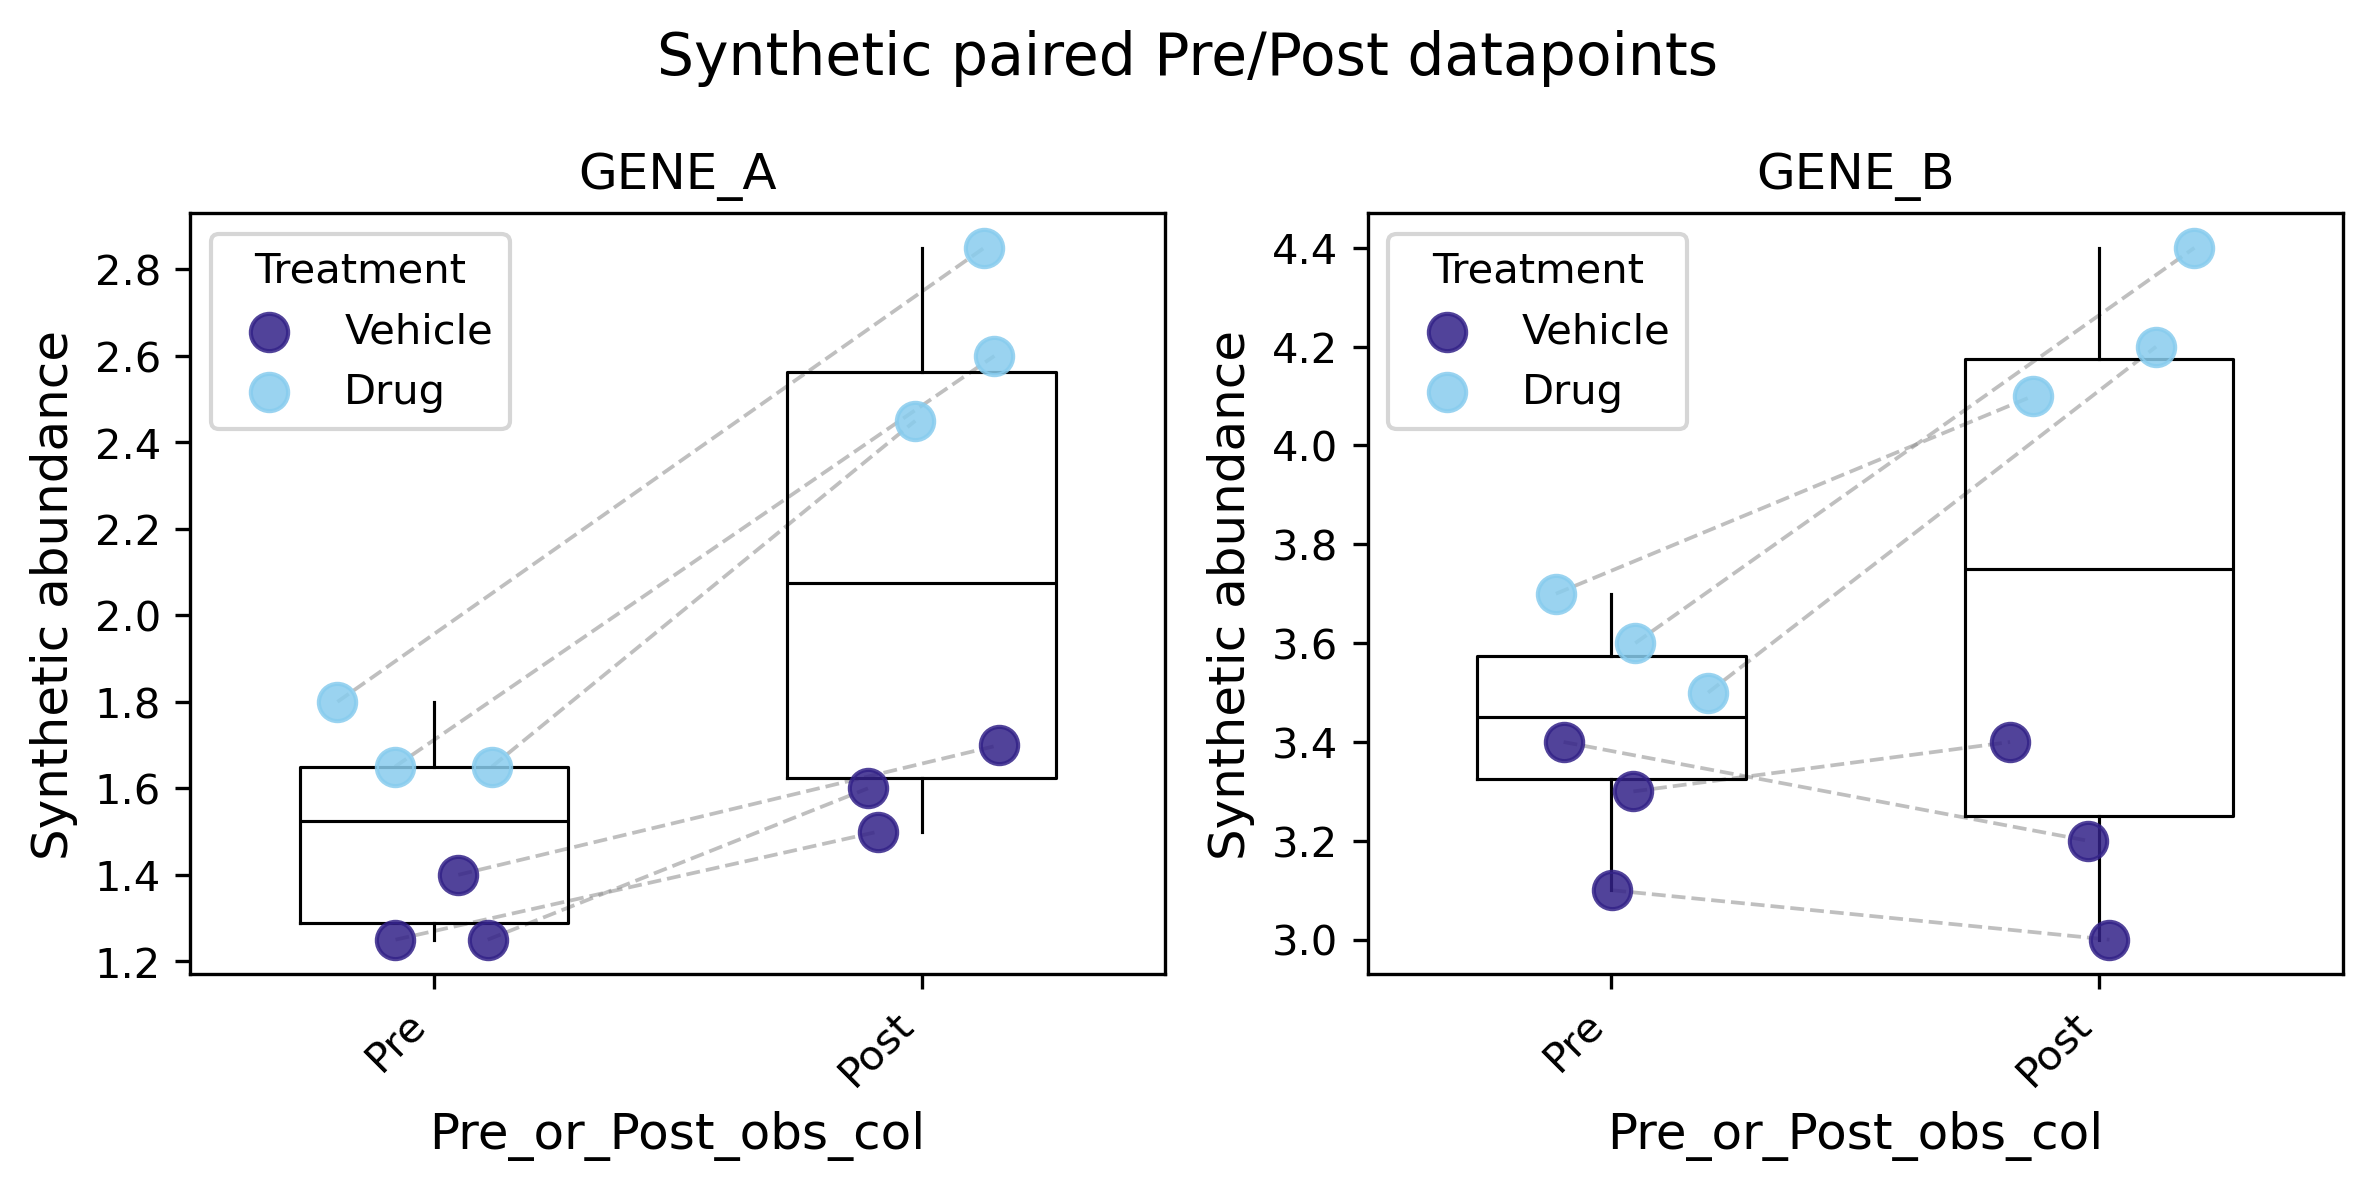
Synthetic example plot
This example uses deterministic synthetic AnnData values with six paired subjects, two treatment groups, and three protein variables grouped into two genes.
import anndata as ad
import numpy as np
import pandas as pd

import adata_science_tools as adtl

obs = pd.DataFrame(
    {
        "Pre_or_Post_obs_col": ["Pre", "Post"] * 6,
        "Subject_ID": ["S1", "S1", "S2", "S2", "S3", "S3", "S4", "S4", "S5", "S5", "S6", "S6"],
        "Treatment": pd.Categorical(
            ["Vehicle", "Vehicle", "Vehicle", "Vehicle", "Drug", "Drug", "Drug", "Drug", "Drug", "Drug", "Vehicle", "Vehicle"]
        ),
    },
    index=[f"s{i}_{side.lower()}" for i in range(1, 7) for side in ("Pre", "Post")],
)
var = pd.DataFrame(
    {
        "Gene": ["GENE_A", "GENE_A", "GENE_B"],
        "feature_type": ["protein", "protein", "protein"],
    },
    index=["GENE_A_v1", "GENE_A_v2", "GENE_B_v1"],
)
X = np.array(
    [
        [1.2, 1.6, 3.4],
        [1.5, 1.9, 3.2],
        [1.0, 1.5, 3.1],
        [1.4, 1.8, 3.0],
        [1.4, 1.9, 3.5],
        [2.3, 2.9, 4.2],
        [1.6, 2.0, 3.6],
        [2.6, 3.1, 4.4],
        [1.5, 1.8, 3.7],
        [2.2, 2.7, 4.1],
        [1.1, 1.4, 3.3],
        [1.3, 1.7, 3.4],
    ]
)
adata = ad.AnnData(X=X, obs=obs, var=var)

fig, axes, plot_df = adtl.paired_datapoints(
    adata=adata,
    var_groupby_key="Gene",
    var_names=["GENE_A", "GENE_B"],
    collapse_mode="aggregate",
    collapse_func="mean",
    pair_by_key="Subject_ID",
    subset_obs_key="Treatment",
    subset_order=["Vehicle", "Drug"],
    legend=True,
    title="Synthetic paired Pre/Post datapoints",
    ylabel="Synthetic abundance",
    random_seed=7,
    figsize=(8, 4),
    savefig=True,
    file_name="docs/assets/paired_datapoints_synthetic_example.png",
    show=False,
)
Supported input modes
adata=...uses.X,adata.layers[layer], oradata.raw.Xwhenuse_raw=True.df=...orinput_data=<DataFrame>expects rows to be observations and selected feature columns to contain the plotted values. Providevar_namesorvar_df.indexso metadata columns are not guessed as features.input_data=<AnnData>is accepted as a convenience for config-driven calls, but cannot be combined with explicitadata=ordf=.The alias
input=...is accepted through**paramsfor YAML/config compatibility wheninput_datais not supplied.
Pairing behavior
The x-axis is ordered as reference then target, with labels from
groupby_key_ref_valueandgroupby_key_target_value.Pairing uses
pair_by_keywhen provided, otherwisesubject_col.Duplicate pair IDs within either side raise
ValueError.Incomplete ref-only or target-only pairs are dropped and logged as warnings.
If no complete pairs remain, the function raises
ValueError.
Bounds
Use side-specific bounds to clamp values before stacking, grouping, filtering, and plotting:
fig, axes, plot_df = adtl.paired_datapoints(
    adata=adata,
    var_names=["IL6"],
    pair_by_key="Subject_ID",
    ref_min_value=0.5,
    target_min_value=0.5,
    bounds_fill_missing=True,
    show=False,
)
Bounds match ref_vs_target_adata() clipping and optional missing-fill
semantics. ref_min_value and ref_max_value apply only to reference values;
target_min_value and target_max_value apply only to target values. The
bounded values are returned in plot_df["value"] and drawn in the plot.
By default, bounds do not impute missing values. Set
bounds_fill_missing=True to fill every missing value on the bounded side
before clipping and value filtering. For example, with target_min_value=1,
all missing target values are filled with 1; with target_max_value=10 and
no target min, all missing target values are filled with 10.
Set bounds_fill_missing_paired_only=True to fill missing values only when the
opposite side of the same pair and variable is present. If both missing-fill
flags are True, the paired-only fill behavior is used. Numeric clipping of
present values is unchanged. A missing side is filled only when that side has a
min or max bound; if no bound is provided for that side, the missing value stays
missing.
For one selected variable with ref_min_value=2, target_min_value=1, and
bounds_fill_missing_paired_only=True, these rows behave as follows:
Raw reference |
Raw target |
Output reference |
Output target |
Reason |
|---|---|---|---|---|
|
|
|
|
Missing target is filled because reference is present. |
|
|
|
|
Both sides are missing, so neither side is filled. |
|
|
|
|
Missing reference is filled because target is present. |
|
|
|
|
Present values are still clipped to their side-specific bounds. |
The paired-only rule is useful when a missing value should be drawn at a limit of detection only if the paired observation exists on the other side:
fig, axes, plot_df = adtl.paired_datapoints(
    adata=adata,
    var_names=["IL6"],
    pair_by_key="Subject_ID",
    ref_min_value=2,
    target_min_value=1,
    bounds_fill_missing_paired_only=True,
    dropna=False,
    show=False,
)
Compared with bounds_fill_missing=True, the paired-only option preserves
complete missing pairs as missing in plot_df["value"]. With the same bounds,
bounds_fill_missing=True would fill a pair where both reference and target
are missing to reference 2 and target 1; bounds_fill_missing_paired_only
leaves both values as NaN. Because paired_datapoints() defaults to
dropna=True, set dropna=False when those both-missing rows should remain in
the returned plot_df.
ref_vs_target_adata() source values
For
ref_vs_target_adata()-style outputs, the function defaults to plotting paired source values fromadata.obsmwhen available.Explicit
ref_values_obsm_keyandtarget_values_obsm_keytake priority.Without explicit keys, the function checks
adata.obsm["pre_values"]andadata.obsm["post_values"], thenadata.obsm["pre"]andadata.obsm["post"], thenadata.obsm["ref_values"]andadata.obsm["target_values"].Source-value
obsmentries may bepandas.DataFrameobjects aligned by observation index and variable columns, or array-like values aligned toadata.obs_namesandadata.var_names.
post_minus_pre = adtl.ref_vs_target_adata(
    adata,
    pair_by_key="Subject_ID",
    save_source_values_obsm=True,
)

fig, axes, plot_df = adtl.paired_datapoints(
    adata=post_minus_pre,
    var_names=["IL6"],
    pair_by_key="Subject_ID",
    show=False,
)
Filtering and subsets
filter_obs_by_isin_lists={"column": ["allowed"]}filters observations with AND semantics before pairing.filter_vars_by_isin_lists={"column": ["allowed"]}filters variables with AND semantics before grouping and collapse.subplot_by_obs_key="column"splits paired records into one subplot per non-missing observation metadata value. For normal Pre/Post-style input, the ref and target rows in a pair must have the same value.subset_obs_key="column"colors points by observation metadata group within each panel.subset_var_key="column"colors points by variable metadata when plotted records map to onesource_variable.subset_ordercontrols hue order; otherwise categorical order or first appearance is used.legend_scope="figure"draws one shared legend for a multi-panel grid.legend_locandlegend_bbox_to_anchorare forwarded to Matplotlib legend placement for either per-axis or figure-level legends.
fig, axes, plot_df = adtl.paired_datapoints(
    adata=adata,
    var_names=["IL6"],
    pair_by_key="subject_id",
    subplot_by_obs_key="subject_id",
    show=False,
)
fig, axes, plot_df = adtl.paired_datapoints(
    adata=adata,
    var_names=["IL6", "TNF", "CRP"],
    pair_by_key="Subject_ID",
    subset_obs_key="cohort",
    legend=True,
    legend_scope="figure",
    legend_loc="center left",
    legend_bbox_to_anchor=(1.02, 0.5),
    show=False,
)
Use subset_var_key with raw-variable rows, such as collapse_mode="stack" or
collapse_mode="all", when hue should come from adata.var or var_df:
fig, axes, plot_df = adtl.paired_datapoints(
    adata=adata,
    var_groupby_key="Gene",
    var_names=["IL6"],
    collapse_mode="stack",
    pair_by_key="Subject_ID",
    subset_var_key="feature_type",
    legend=True,
    legend_scope="figure",
    legend_loc="center left",
    legend_bbox_to_anchor=(1.02, 0.5),
    show=False,
)
Variable grouping and collapse
With
var_groupby_key=None,var_namesselects raw variable names.With
var_groupby_key="column",var_namesselects group names in variable metadata, matchingadata_histograms().collapse_mode="aggregate"reduces each selected variable group to one value per pair side usingcollapse_func.collapse_mode="stack"keeps raw variable-level values and includessource_variableinplot_df. Paired lines connect the same pair and raw variable where both ref and target values remain after filtering.collapse_mode="all"stacks all selected raw variables into one panel named"all".collapse_func="select_max_ref_value"is AnnData-only, requiresvar_groupby_key, and selects the raw variable with the largest non-missing reference value per pair and group. Ties are logged and resolved by filtered variable order.subset_var_keyis not supported for grouped aggregate reductions such asmean,median, orsum, because those rows combine multiple variables. Usecollapse_mode="stack",collapse_mode="all", ungrouped variables, orcollapse_func="select_max_ref_value"when variable-metadata hue is needed.
Logging
The function uses logging.getLogger(__name__) by default. Pass logger=... to
route messages elsewhere, and pass log_level=... to set that logger’s level
for this call. The function logs selected source-value obsm keys, dropped
incomplete pairs, stack-mode line behavior, and tied select_max_ref_value
choices.
Return value
The return value is (fig, axes, plot_df).
figis the matplotlib figure.axesis a dict keyed by panel name.plot_dfis the long-form plotting table with at leastpanel,variable,source_variable,pair_id,x_label,x_order, andvalue.When
show=False, the figure is closed before returning, matching the package’s test-backed plotting APIs.